Momme C.Hell and Christopher Horvat have published a new paper paper related to their work in SASIP-WP3:
A method for constructing directional surface wave spectra from ICESat-2 altimetry, 2024, The Cryosphere.
Surface waves impact Sea Ice Fracture in the MIZ, but wave attenuation in sea ice is one of the least constrained processes in current sea ice models. We hear how a method that provide 2D wave spectra in sea ice along ICESat-2 tracks. We use a combination of linear inverse methods and Monte-Carlo sampling on all 6 laser beams to constrain the wave spectra about every 25 km. This allows us to derive a large, global databases of wave attenuation in sea ice and will be on of the first examples of remote-sensing and data-driven parametrization for climate models.
https://doi.org/10.5194/tc-18-341-2024

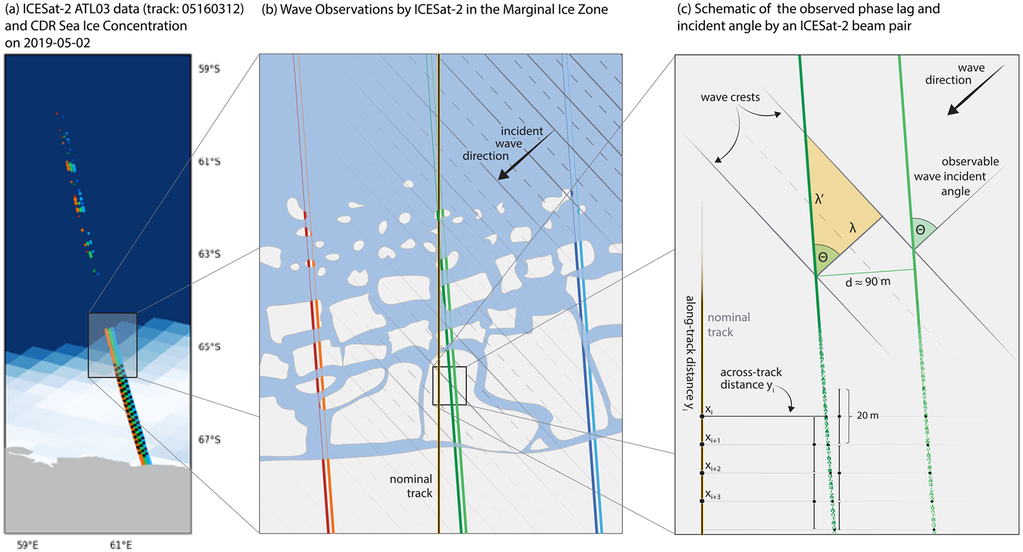
Fig.1 (from C.Hell and Horvat 2024): Illustration of ICESat-2 (IS2) beams intersecting the Marginal Ice Zone (MIZ) under the presence of waves. (a) IS2 data and the CDR Sea Ice Concentration for track 05160312 on 2 May 2019. The three beam pairs are shown as red and orange (gt1l and gt1r), dark and light green (gt2l and gt2r), or dark and light blue (gt3l and gt3r) lines. The black dots show the segment positions 12.5 km apart (defined in Sect. 2.3). (b) Schematic of the IS2 beams that observe sea ice and surface waves in the MIZ. The vertical black line is the nominal IS2 reference ground track. The incident waves come from the top right along the black arrow with wave crests (solid) and valleys (dashed). (c) Detailed view of an ideal monochromatic wave observation by IS2 in sea ice. The IS2 beam pair (light and dark green lines) observes an incident wave (along the black arrow) of wavelength λ with an angle θ as λ′. With the beam-pair distance d, one can calculate θ from the phase lag of the incident wave crests (Sect. 3.1). The along- and across-track coordinate system is referenced to the nominal track, while each data point is the weighted mean of a 20 m stencil (Sect. 2.1).


