Guillaume Boutin et al. have published a new paper paper related to their work in SASIP-WP3:
Modelling the Arctic Wave-Affected Marginal Ice Zone: A Comparison with ICESat-2 Observations., 2022, Philosophical Transactions of the Royal Society A: Mathematical, Physical and Engineering Sciences 380 (September).
Boutin, G., T. Williams, C. Horvat, and L. Brodeau.
https://doi.org/10.1098/rsta.2021.0262.
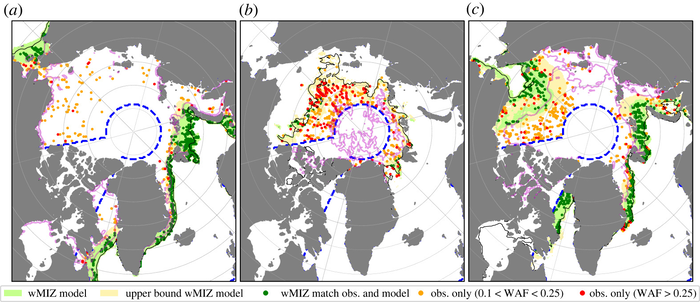
Fig.2 (from Boutin et al 2022): (a–c) Comparison of the wMIZ between the model (using REF and the maximum 𝐻𝑠 for each month) and IS-2, for the months of February (a), August (b) and November (c) 2019. The blue dashed line corresponds to the domain where we perform the quantitative analysis, ignoring the Canadian Archipelago, the Baltic Sea and Hudson Bay. The green and yellow shaded areas correspond to the modelled wMIZ using the criteria that the monthly maximum value of 𝐻𝑠 in ice is higher than 1.50 m and 0.50 m, respectively. Points with detected waves (WAF>0.1) within the wMIZ are in darker green. Red (orange) points show wave observations with WAF>0.25 (0.1<WAF<0.25) that are not encompassed by the modelled wMIZ. The thin solid black contour represents the area with an averaged total sea-ice concentration above 15%. The magenta contour represents the area with an averaged sea-ice concentration above 80%, ignoring newly formed ice in the model (…).

